UK: +44 (0) 191 587 8730 | US: +1-813-886-2775
What are ‘O Curves’ and how do I create them?
Manufacturers of NIBP monitors all use slightly different software algorithms to determine Systolic and Diastolic values. By creating a custom ‘O Curve’ for a particular pressure simulation the BP-SIM can be made to match the NIBP Monitor much closer than using a Default ‘O Curve’.
The purpose of this document is to provide information on how to create new ‘O Curves’ for an NIBP monitor. This document will also explain how to load the curve into the BP SIM.
Items Required:
1. NIBP Monitor under test.
2. PC with Bluetooth connectivity
3. Calibrated BP-SIM unit
4. ‘O Curve’ Template
5. Microsoft Excel
6. Data Transfer software (found on Rigel Utilities CD)
Setting up the BP-SIM
Set the PC being used to be the default computer in the Bluetooth Favourites of the BPSIM, refer to section 3.4 of the BP-SIM User Manual.
‘O Curve’ Format
Appendix 1 shows the data format of an ‘O Curve’. This format must be followed at all times in order that the system will function correctly.
a) Line 1 - [Ocurve], this informs the BP-SIM unit that the following data is an ‘O Curve’. This should not be changed!
b) Line 2 – Default, this is the name that will appear in the ‘Monitor Type’ box in the ‘NIBP Test Settings’ screen. This name has a maximum of 31 characters.
c) Line 3 – 120,80 these two numbers are the Systolic and Diastolic pressures being simulated. These numbers appear in the ‘Systolic/Diastolic’ box in the ‘NIBP Test Settings’ screen.
d) Line 4 – 80,1 the first of these two numbers is the default heart rate that will appear in the ‘Heart Rate’ box in the ‘NIBP Test Settings’ screen. The second number refers to the Adult/Infant Pulse volume settings.
0 = Adult – Low pulse volume
1 = Adult – Medium pulse volume
2 = Adult – High pulse volume
3 = Infant – Low pulse volume
4 = Infant – Medium pulse volume
5 = Infant – High pulse volume
It is recommended that the medium pulse volume be used for both the Adult or Infant monitor/cuff configuration.
e) Lines 5 to 43 – 15,12 these lines are the data that forms the actual ‘O Curve’.
The numbers in the left column form the x axis which is the pressure (in mmHg).
The numbers in the right column form the y axis which is the pulse amplitude.
Note 1 - The example shown in appendix 1 has 39 data points, the maximum
number of data points is however 41. The minimum number of data points is 3.
Note 2 - The peak pulse amplitude should not exceed 127.
f) Line 44 [END], - this line indicates the end of the data file. This should not be
changed!
‘O Curve’ Template
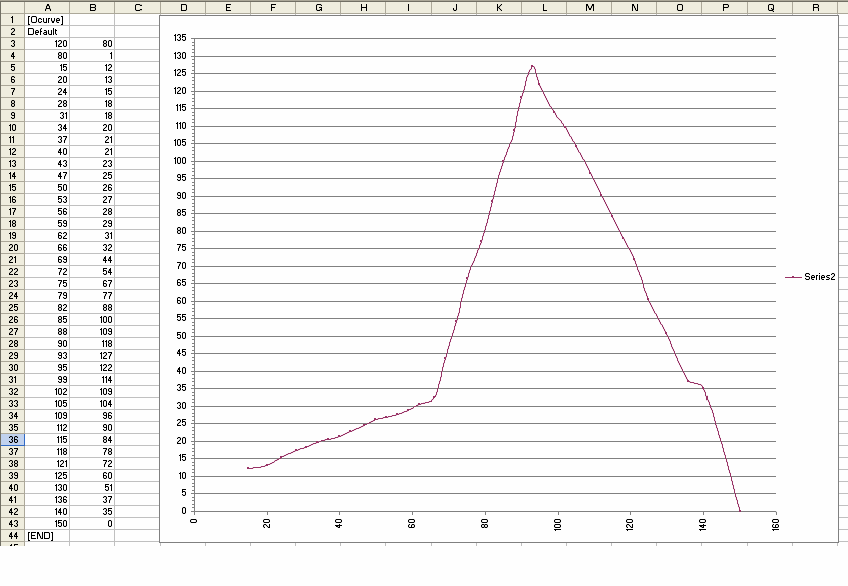
The data shown in appendix 1 can be input to an Excel spreadsheet as shown in appendix 2. An ‘x-y scatter graph’ can be created using lines 5 to 43 as the source data. This type of graph will allow you to click on the graph point and adjust the shape of the graph. The data for this adjusted graph is automatically added to the data lines (5 to 43).
The graph can be adjusted to whatever shape is required in order to create a new ‘O
Curve’. When complete the file should be saved as a Microsoft Excel Workbook file (.xls).The name of this file is unimportant as the BP-SIM will not reference it however a sensible convention may be ‘MonitorType1_120_80_test1.XLS’. Using the ‘Save As’ function this file must now be saved as a .csv file.
Transferring ‘O Curve’ to BP-SIM
In order to get the new ‘O Curve’ into the BP-SIM switch on the unit and select (F4).
Scroll down to Data Transfer and press the Right Arrow button. Scroll down to Configuration Data and press (F4) as shown in Figure 1.
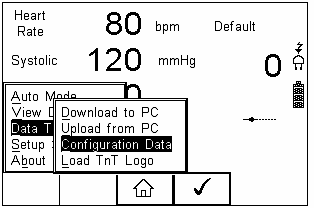
Figure 1. Configuration Data
At this point the BP-SIM will attempt to make a Bluetooth connection to the PC.
Once a connection is made the screen above will be seen. At this point start the Data Transfer software on the PC.
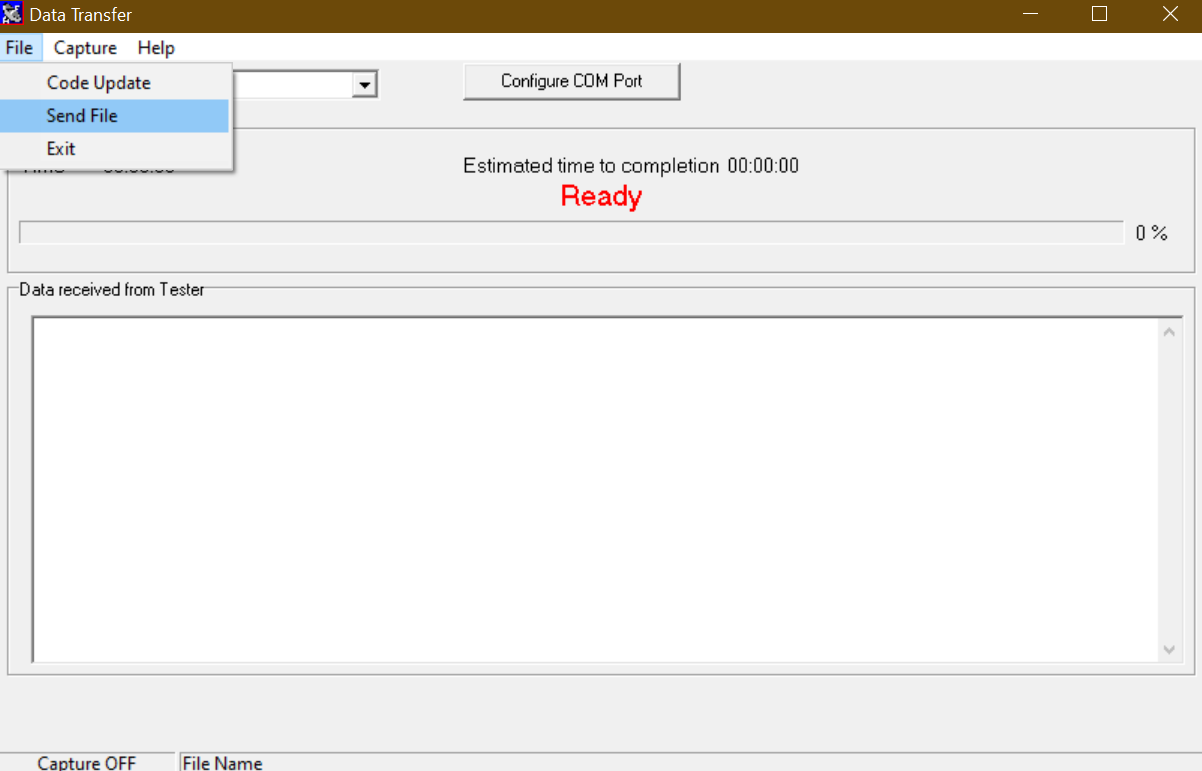
Select File and Send File.
Change the Files of Type to All Files. Select the .csv file to be transferred and hit Open.
The file will be transferred in around 2 seconds. The BP-SIM will show
Valid Data Received.
Press (F3) to return to the main screen.
Testing the new ‘O Curve’
The new monitor ‘O Curve’ can be selected by pressing NIBP (F3) followed by (F4) to select NIBP Test Settings. Use the arrow buttons to select the new Monitor Type and the Systolic/Diastolic values. Press (F4) when complete.
Press the Green Start button and then start the monitor reading.
It is recommended that if 20 tests are performed on an ‘O Curve’ the average Systolic and Diastolic readings should be within ±1mmHg of target and the repeatability over the 20 tests should be within ±3mmHg of target.
Troubleshooting
The problems below have been reported by people attempting to create new ‘O Curves’.
a) File format - If the BP-SIM shows an error during Data Transfer or the new ‘O curve’ does not appear to work correctly the file format should be checked using a text editor such as Notepad. It is possible that Excel can add extra commas to the data file when saving as csv format. These must be removed.
b) Not able to adjust the graph points - It has been reported that not all versions of Excel will allow the graph points to be selected and moved. This feature does work with Excel 2002 but may not work with later versions.
c) Selecting new monitor type - Every time a new ‘O Curve’ is transferred to the BP-SIM it must be selected even if it is already shown on the display. If this is not done an older version of the ‘O Curve’ will be selected.
Note: a new ‘O Curve’ with the same Monitor Type and Systolic/Diastolic settings as an existing ‘O Curve’ will always overwrite the older version.
Appendix 1 ‘O Curve’ Data Format
[Ocurve],
Default,
120,80
80,1
15,12
20,13
24,15
28,18
31,18
34,20
37,21
40,21
43,23
47,25
50,26
53,27
56,28
59,29
62,31
66,32
69,44
72,54
75,67
79,77
82,88
85,100
88,109
90,118
93,127
95,122
99,114
102,109
105,104
109,96
112,90
115,84
118,78
121,72
125,60
130,51
136,37
140,35
150,0
Appendix 2 ‘O Curve’ Template
I'd like to talk to a sales advisor


Sign up to our Newsletter.
Stay up to date with the latest industry and product news, as well as our free educational content such as webinars and our expert guides.
Close