Manufacturers of SP02 monitors all use different algorithms to determine the R-Curves. By creating a custom ‘R -Curve’ for a particular monitor or manufacturer types the UNI/SP-Sim can be made to match the SP02 Monitor more accurately.
The purpose of this document is to provide information on how to create ‘R-Curves’ for an SP02 monitor and add them to part of a test sequence within Med-eBase.
Note: These ‘R-Curves’ are for use with the optical finger adapter box only
The R-Curve is capable of having a variable number of adaptor IDs ( max 128 ) allowed to be used with it and a variable number of data points ( max 51 ) defining the curve.
Equipment required:
- SP02 Monitor
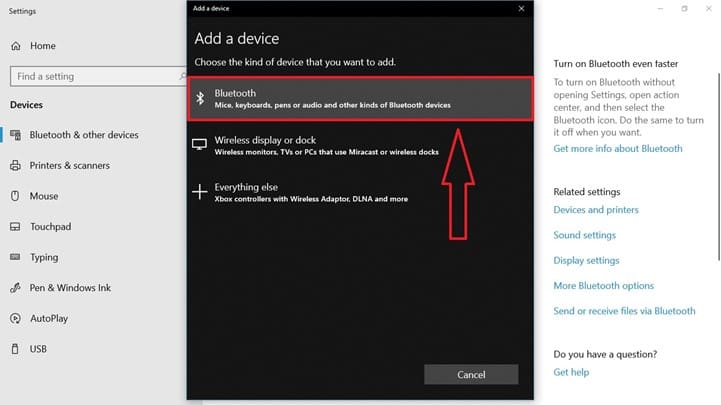
- PC with Bluetooth connectivity
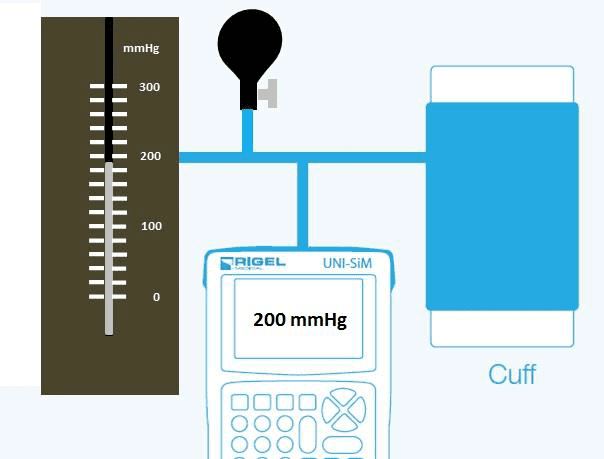
- Calibrated Uni/SP- Sim
- ‘R-Curve’ Template
- Microsoft notepad or excel
- Data Transfer software (Available at Rigelmedical.com)
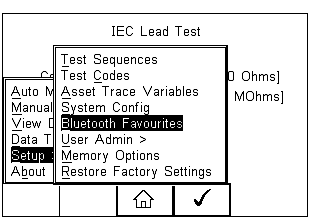
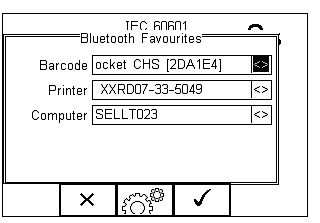
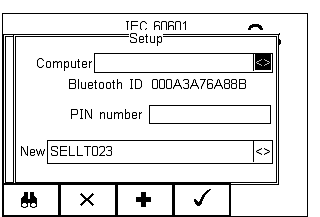
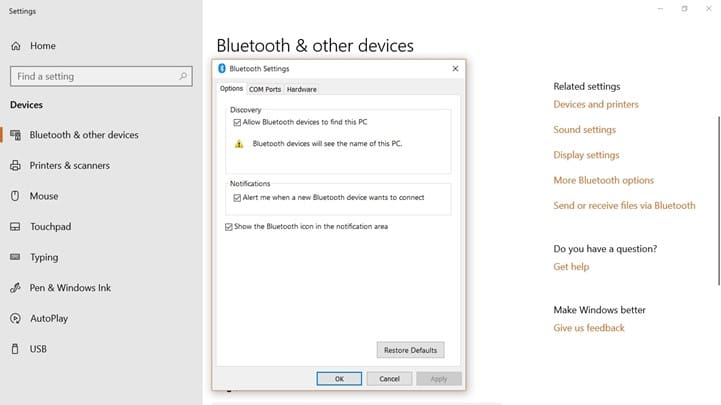
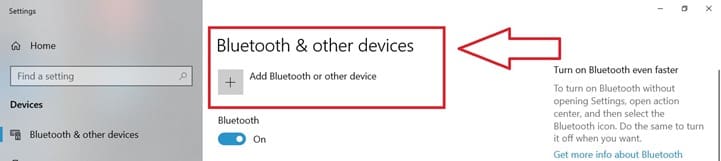
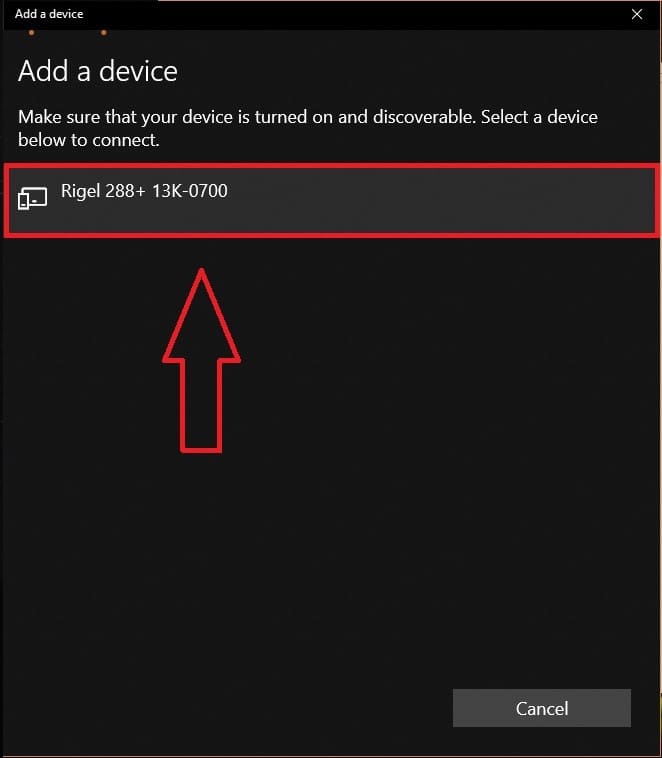
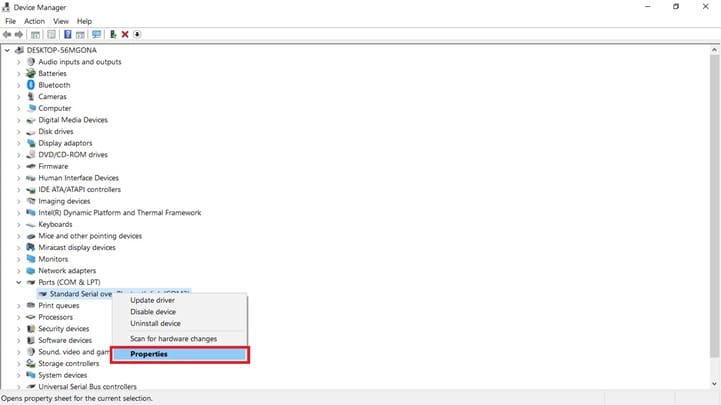
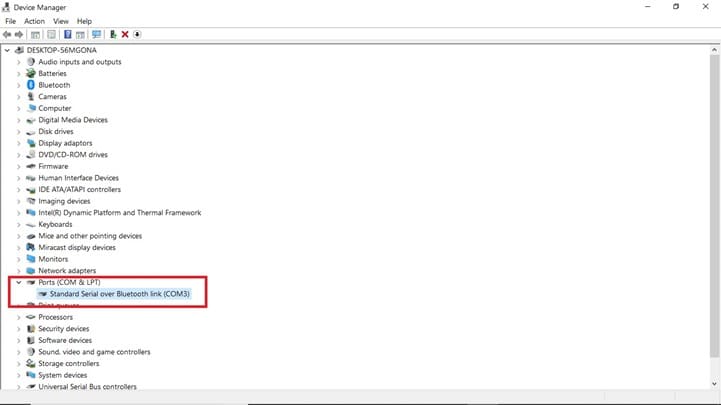
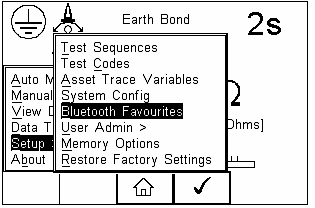
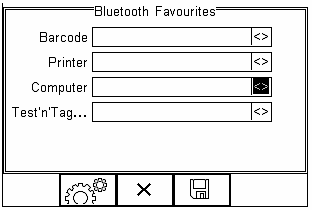
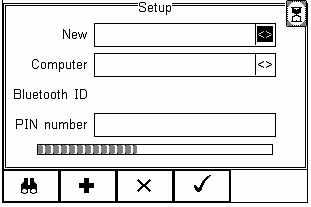
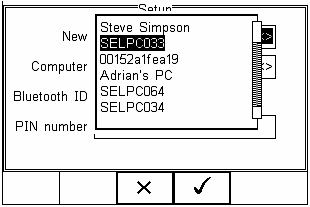
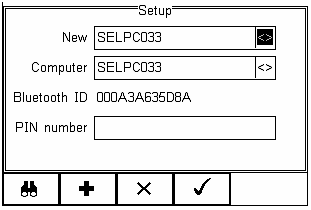
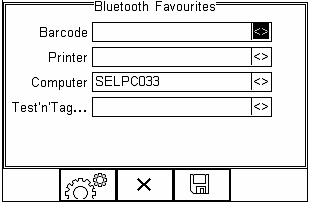
Make sure your Rigel device is paired with the PC using Bluetooth Favourites (Please see FAQ on pairing using Bluetooth favourites)
Please contact support@rigelmedical.com if you do not have a default R-Curve
The ‘R-Curve’ format in excel must be followed in order that the system will function correctly.
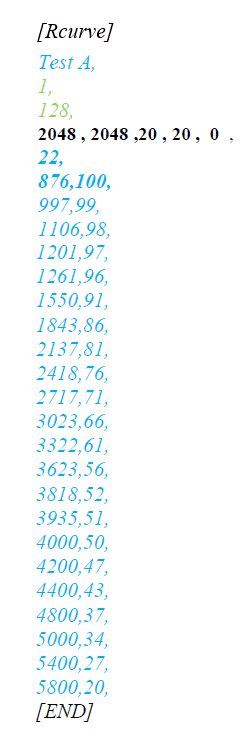
1) Line 1: [RCURVE]
This is standard and should not be altered as it tells the unit that the following data is an ‘R-Curve’.
2) Line 2: Curve Name,
This should be the name of the monitor/manufacturer. Whatever is writing in line 2 will appear in the ‘Monitor Type’ field in the ‘SP02 Test settings’ screen on the UNI/SP-Sim. The name must be between 1 and 32 characters in length.
3) Line 3: 1,
The value should indicate the number of adapters available. The R curve is capable of having a variable number of adaptor IDs allowed to be used.
Note: Currently only the optical finger is compatible with customised ‘R-Curves and therefore the value in line 3 should be 1.
4) Line 4: 128,
This line should indicate the adapter ID(s) for the adapter(s) being used. If multiple adapters are used separate ID numbers on a new line: line 5: adapter ID 2, Line x: adapter ID x etc.
Note: Currently only the PULS-R is available and therefore the adapter ID in line 4 should be 128.
5) Line 5: 2048, 2048, 20 , 20 , 0 ,
This is the Pulsar data (red threshold, IR threshold, red pot, IR pot, control) These are mandatory values which should not be altered.
6) Line 6: 22,
This is the number of data points for the R-Curve. A variable number of data points to a maximum of 51 can be used to define the curve. For this example 22 data points have been used.
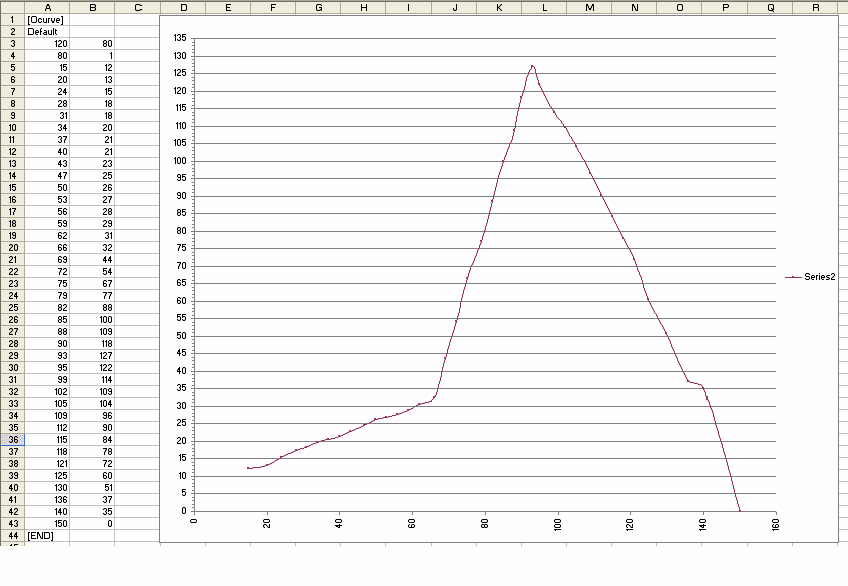
7) Line 7 to end: K value 1, spo2 % 1.,
The values in these lines are the data points that form the actual ‘R-Curve’. Each data point should be on a separate line: Therefore Line 8: K value 2, spo2 % 2 etc. The numbers in the left column form the gain value required to make the PULS-R show the correct Sp02 percentage in the right column. The list of paired data entries have a range of K Value from 8192 (0%) to 1000 (100%).
Saturation Percent (0% to 100%) with the Saturation Percent must be in descending order.
Note: The maximum number of data points is 51 and the minimum is 3.
8) Last line [END]
This is a mandatory line which indicates the end of the data file and should not be changed. When complete the file should be saved as a csv file. The name of this file is unimportant as the Uni/SP-Sim will reference line 2 (monitor/manufacture name). However; a practical filename may be ‘MonitorTypeA_SP02.csv’.
Note: When saving from Excel as CSV please reopen the file in a program like Notepad and make sure that any additional commas etc. have not been inserted into the file as this may cause a failure when attempting to upload.
Example R-Curve
Lines in BLACK are mandatory and should not be changed.
Lines in Green indicate that currently only the PULS-R is currently available as adapter option and therefore should not be altered
Lines in Blue are changeable

Finding the correct SP02 and k values for your monitor
There are a variety of options to creating your own R-Curves. You may need to use more than one of the below options
to produce the most accurate R-Curve for your monitor/probe type:
1. Selecting the Sp02 Curve from the default R –Curves on the PULS-R
When customising an R-Curve you can upload and test the default curve, link previously given, or the default curves on the PULS-R to determine which is the closest match to the monitor type being tested. Record the Sp02 values are indicated on the Monitor corresponding to the expected reading from the UNI/SP-Sim. Continue with this process for the range of values required. Please see the uploading R-Curve onto UNI/SP-Sim section below on how to correctly upload the Curves into the testers.
Please see the PULS-R datasheet for the list of R-Curves and specification for accuracy and repeatability.
Use the most similar curve and then use one of the points below to improvement the accuracy of the SP02 curve for your required monitor type.
1.1. Changing the SP02 value
For example using the provided csv R-Curve on Sp02 Monitor Type A 100% may read 98% and 90% may read 89%.
Open the file on the PC and change the Sp02 values to match the indicated values from the monitor. From the example file change line 7 from 1020 100 to 1020 98 and line12 from 1690 90 to 1690 89.
Upload the file again and check to confirm if the accuracy has now increased. It is recommended that you rename the test to
minimise confusion when uploading and running R-Curves.
Continue with this pattern until happy with the overall results for the required range of SP02 values.
1.2. Changing the k value
The K value can also be changed to generate the correct sp02 value however this is more difficult than altering the sp02 values, see 1.1 above. For example, if the user requires an SP02 value of 100% the K value can be decreased until the monitor reads 100%. You would need to upload the csv file onto the UNI/SP-Sim to confirm the new curves accuracy. Repeat until you are happy with the created R-Curve.
1.3. Using the default values to find additional k and SP02 values.
If the value which you want to test is not already in the default list, from the example there is no 75%, you may need to determine the K value required and extrapolate two known values.
For example: 73 and 78% are shown in the file. If you require a value for 75% the 73 and 78% values can be used to determine the 75% k value.
Line 16 is 2351 73, and line 15 is 2180 78. Estimation for the K value for 75% can be produced by dividing k1/sp02 and then times the answer by the required SP02 value to find possible new K value.
2180/78 = 27.95
27.95 x 75 = 2096
The new line would then be inserted into the csv file and the number of lines required, line 6, would need to be altered to reflect the new number of lines in the R-Curve. The R-Curve would need to be uploaded into the Un/SP-Sim and then the 75% value simulated to make sure the K value selected was correct.
It is advised that at least 15 to 20 points are created for each curve 100-90% in steps of 1 and then between 5 or 10 additional points for the rest of the curve is advised.
Uploading ‘R-Curve’ to Rigel Uni/SP-Sim
We strongly advise that users also upload the ‘R-Curve’ into the Uni-Sim for quick testing in manual mode.
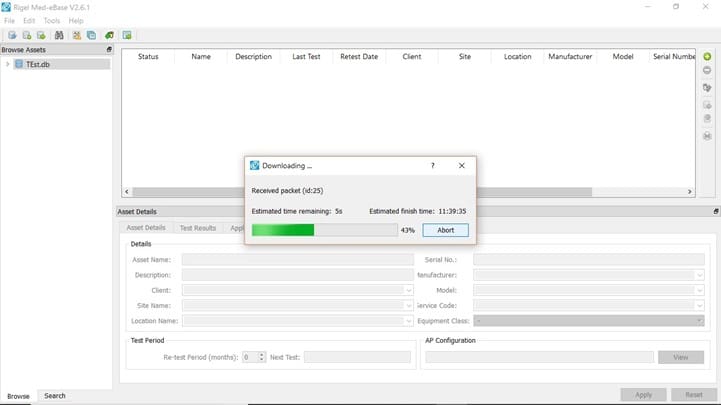
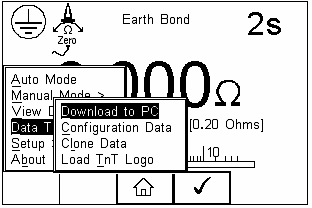
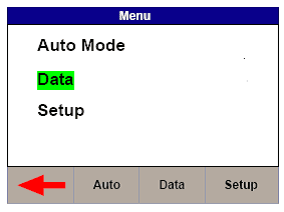
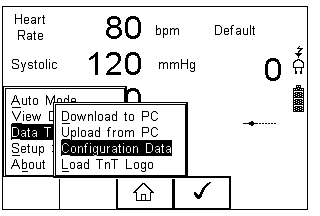
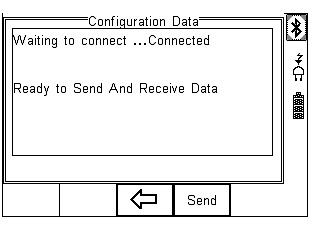
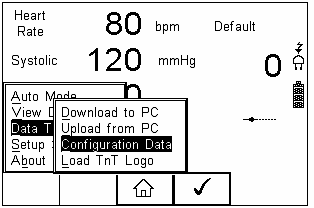
1) In order to get the new ‘R-Curve’ into the Uni/SP Sim switch on the unit and select F4. Select D Data Transfer and then C Configuration Data and press F4.
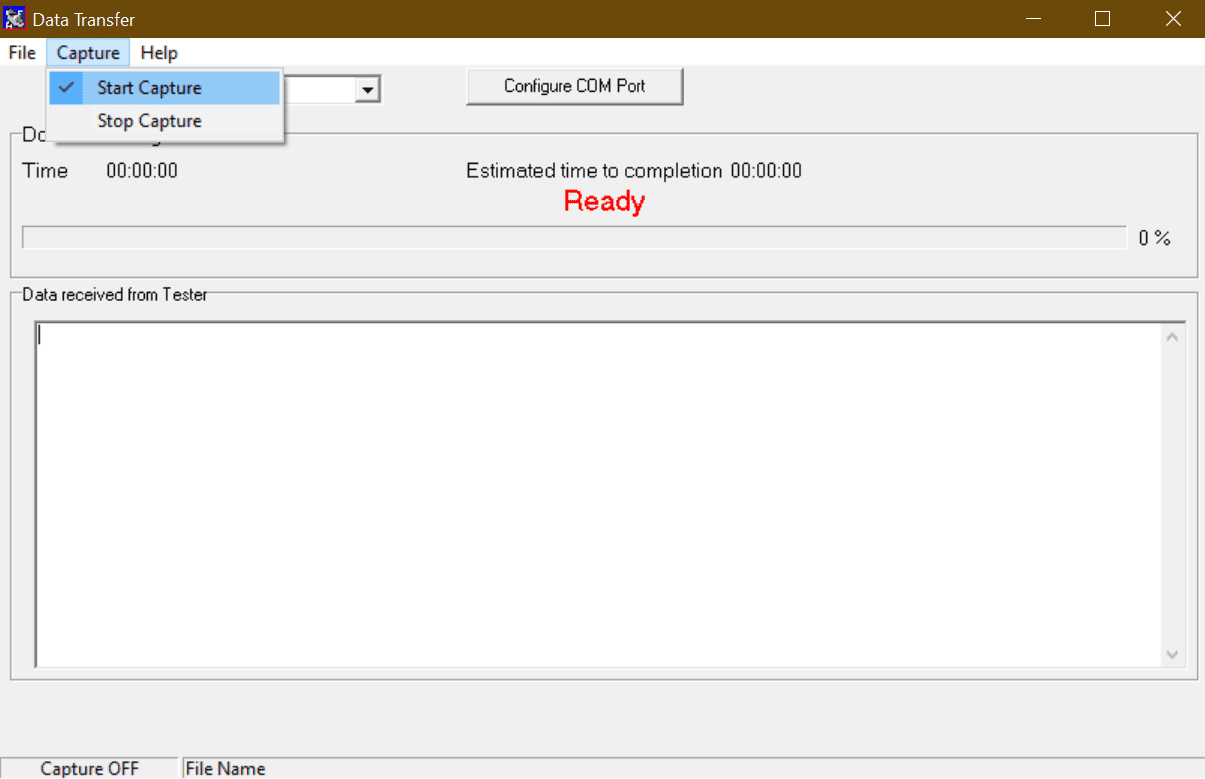
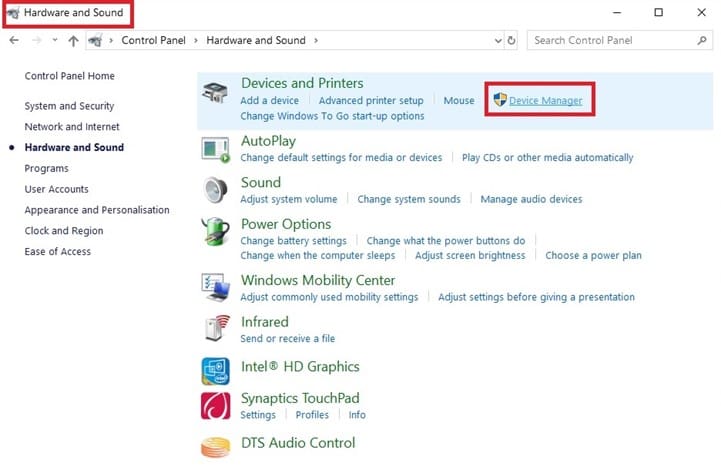
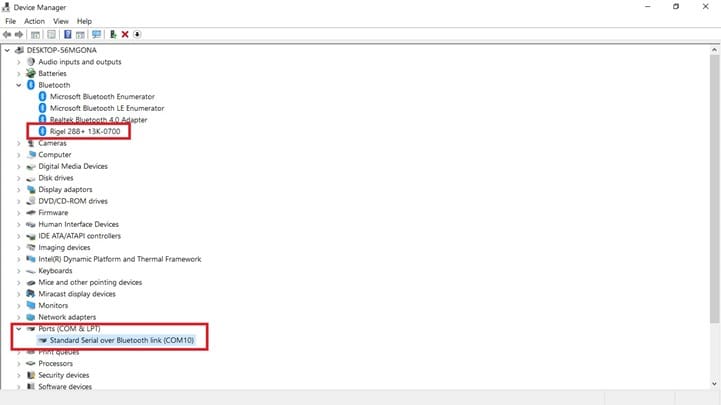
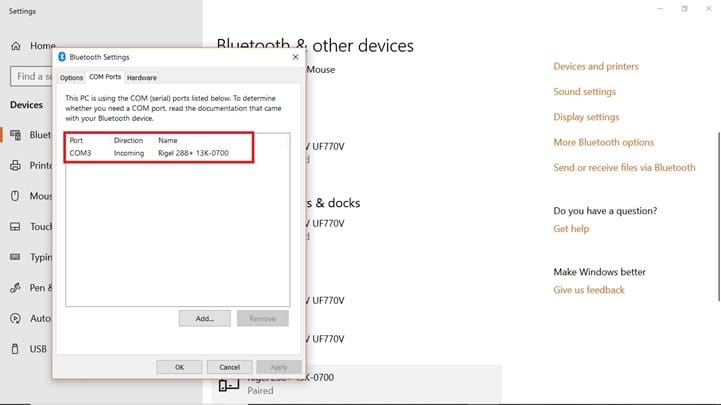
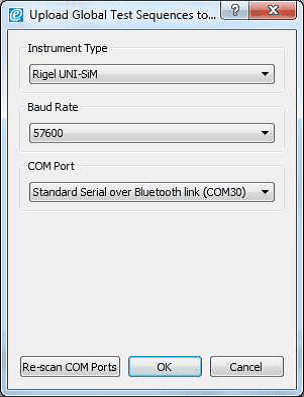
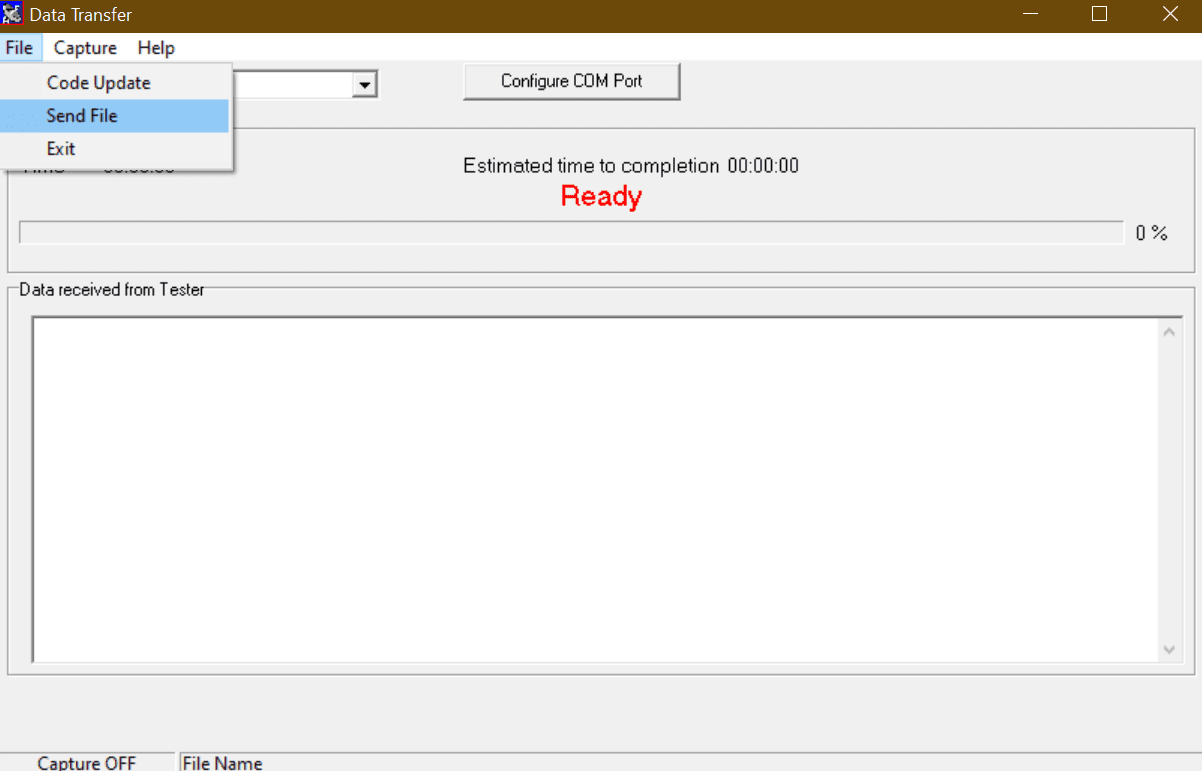
2) Open the DataTransfer.exe software program on the PC. Select the corresponding COM Port and then select File and Send File.
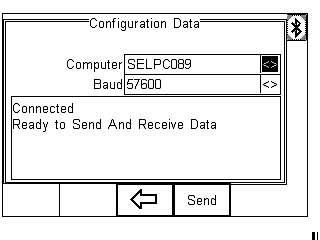
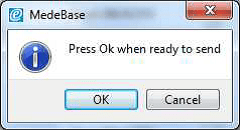
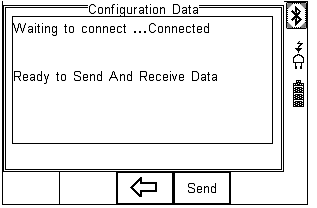
3) The Uni/SP Sim will then attempt to make a Bluetooth connection to the PC (Once a connection is made ‘Ready to Send and Receive Data’ will appear on the screen of the Rigel device.
4) Change the Files of Type field to All Files and then select the correct .csv file and select Open.
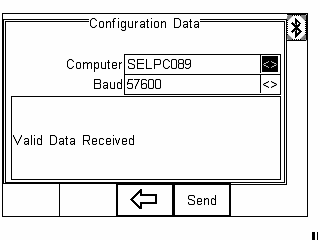
5) The file will be transferred in around 2 seconds. The
Uni/SP-Sim will show Valid Data Received.
Note: If corrupt data message appears this is an indication that something within the file is incorrect. Therefore it is advised to check the file for incorrect values or commas etc. and then resend the file to the SP/Uni-Sim.
6) Press F3 to return to the main screen
Testing the uploaded ‘R-Curve’
The new ‘R-Curve’ can be selected by the following options on the Uni-Sim and SP-Sim
UNI-Sim
Select SP02 (F2) followed by SP02 (F3). Use the arrow buttons in the Technology field and select the new Monitor Type which you
have created and uploaded to the device. Then press Confirm (F4). Press the Green button to start the SP02 simulation.
SP-Sim
Select SP02 (F3). Use the arrow buttons in the Technology field and select the new Monitor Type which you have created and uploaded to the device. Then press Confirm (F4). Press the Green button to start the SP02 simulation.
Note: In a test sequence containing a Custom ‘R-Curve’ uploaded from Med-eBase the R-Curve is not stored within the unit and therefore CAN NOT be edited in the sequence. The SP02 setting within the sequence would need to be deleted and then reinserted after the ‘R-Curve’ has been uploaded onto the Uni-Sim.
Uploading ‘R-Curves’ into Med-eBase
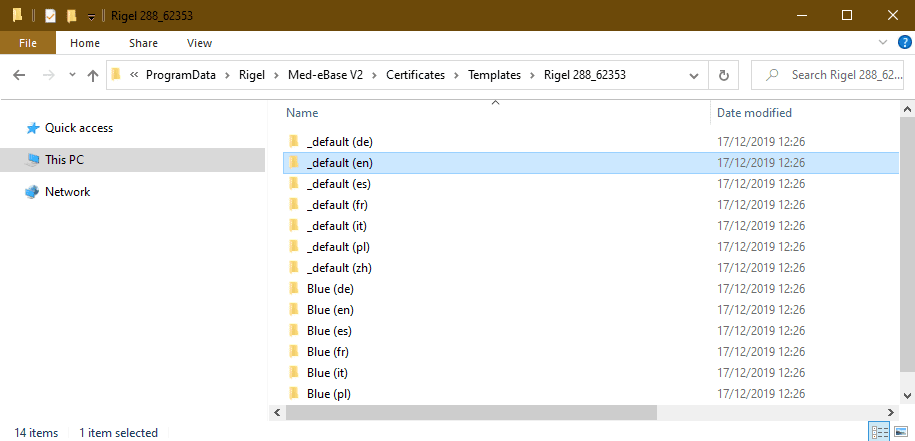
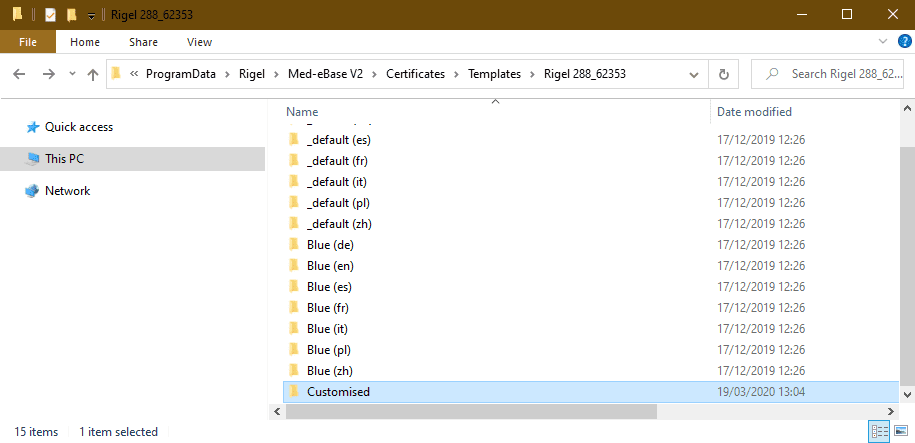
We strongly advise that the ‘R-Curves’ are inserted into Med-eBase V2 R-Curves data folder to enable users to create test sequence using the software which can then be uploaded to the UNI/SP-Sim
The ‘R-Curve’ data folder can be found in one of the following locations which Med-eBase has been installed on.
For Windows XP: C:Documents and SettingsAll UsersApplication DataRigelMed-eBase V2RCurves
For Windows 7: C:ProgramDataRigelMed-eBase V2RCurves
Note: Program Data and Application Data may be hidden folders. To view these folders:
In XP, go to Tools and then Folder Options and in Windows 7, go to Organize then Folder
Then select the View tab and “Show hidden files and folders”, click Apply and then Ok
Save the file in the folder indicated above
Creating Test sequence with the new R-Curve
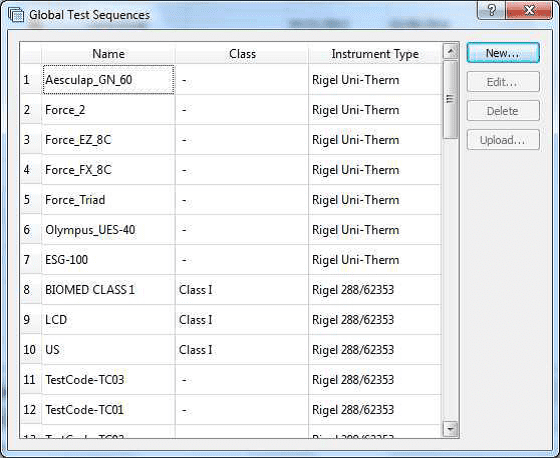
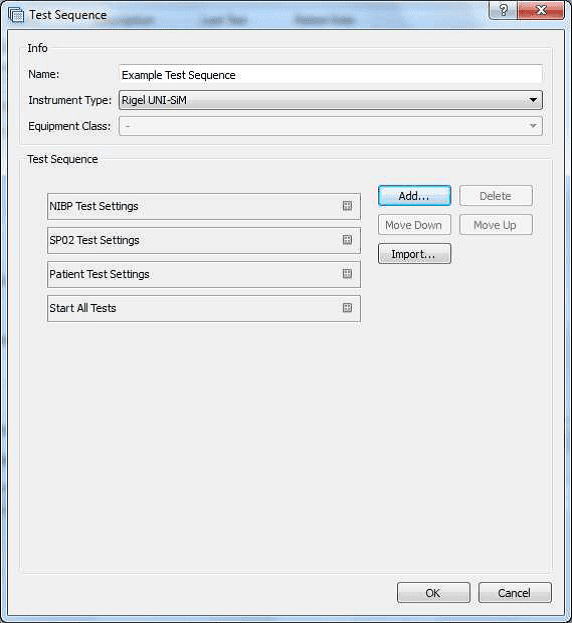
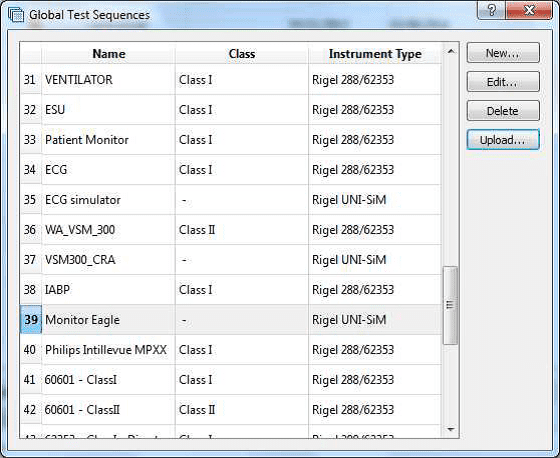
Open Med-eBase and select Tools > Global Test Sequences > New.
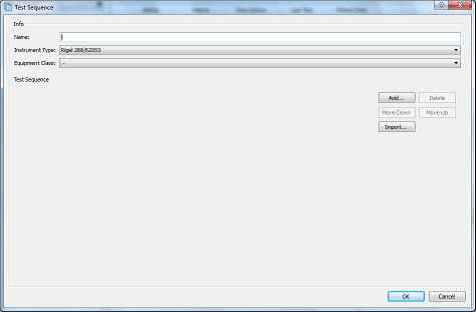
Then select SP/Uni Sim and enter the name of the new test sequence.
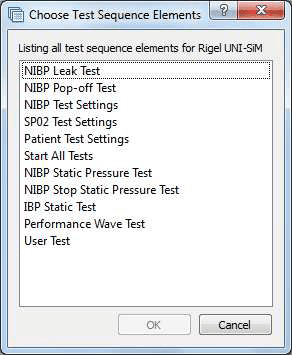
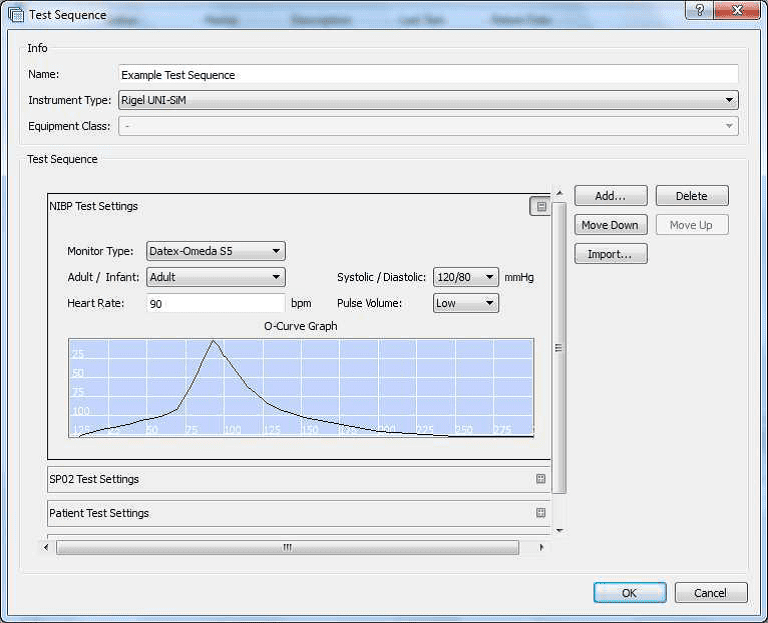
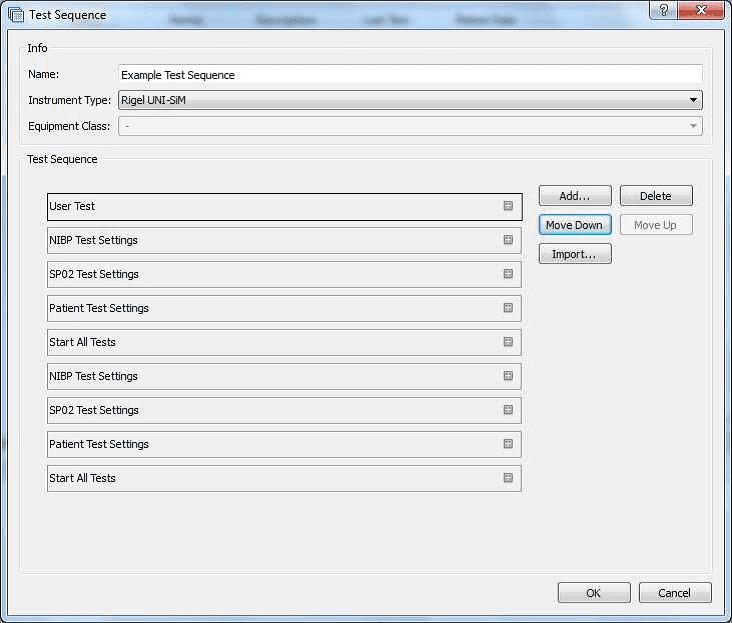
Add… then select ‘SP02 Test Setting’, click on the + and there will be a drop down list in Monitor Type field where you can select your ‘R-Curve’.
If there is an error within the file Med-eBase will show the message below which will indicate the possible error within the document.